Getting a step better in planning projects every day
Logically you would say so. You always get more insight and experience in the scheduling process, and you build on that. But how do you that? For example, higher productivity would not necessarily imply that you became better in planning. In this blog, we describe how you can measure the planning performance of your organization.
Why measure planning performance?
Why would you want to measure the planning performance? Because you want to have a grip on things. When it comes to staff utilization and project and activity progress, you want to be in control. You want to predict the required hours as best you can and always improve. In that respect, this fits in well in the concept of Lean thinking.
Measuring the planning performance, for example, can provide insight into:
Such insights are valuable to everyone: the management, managers, project managers and even employees. Based on these insights, you can decide to organize yourself differently. The implementation of erratic projects you can, for example, allocate to a separate unit and leave the stable projects in a unit where you can optimize utilization.
You can assist executives and project managers who are scheduling below par in improving their planning skills. Next to that, you can help employees who continuously spend too much time to see where the problems lie and how you can solve this with them. In short: measuring and improving the planning performance can raise your organization to a higher level.
How do you calculate it?
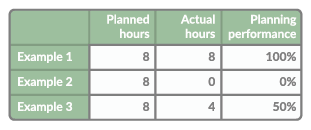
To establish the planning performance, you need to record the actual hours. Otherwise, we have nothing to compare with. Furthermore, as a starting point, we express the planning performance in a percentage. If you have eight hours planned and you also spent eight hours, then your planning performance is 8/8 = 100%. If you have spent zero hours, then the planning performance is 0/8 = 0%. And at an actual spending of four hours, the planning performance is 4/8 = 50%.
But now…
Suppose you have eight hours planned and twelve hours spent. You then allocate eight hours on schedule in the planning, but you have spent four more hours. How do you evaluate this?
If we total the line of the examples, we will come out on 12/8 = 150% performance. That is highly debatable. Exceptions then work positively on the performance figures. That does not give a good picture, whether you plan well or not. Besides, as a starting point, we have assumed that you can never have more than a hundred per cent planning performance.
You can also turn it around and take the actual hours as the divisor. Then the performance becomes 8/12 = 67%. On the one hand, something could be said, because in this example there were more hours needed; then those hours should also have been planned. On the other hand, unnecessary exceptions (read: errors) could affect the conclusion of whether or not you plan well. That is not correct, so this calculation is also debatable.
You might also be able to express the difference (four hours exception) in relation to the planned hours. You’ll get a performance of 4/8 = 50%. With the exception of eight hours, however, you get 8/8 = 100% performance. That makes no sense and is, therefore, not usable.
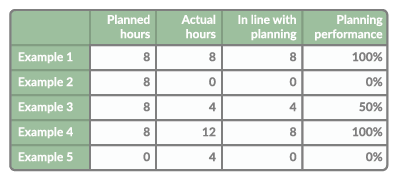
The conclusion is that you should round off exceptions and not add them. You should state that you want to know if you spent the planned hours. So you look to see what hours are in line with the schedule. In the following examples, the planning performance is then:
Reporting
When reporting, do not lose yourself in the details. There is no use in making analyses per post as in the above examples. The danger is that you then conclude based on a few cases. Thus you reach no statistical relevance. It is therefore essential that you look more at totals by project, department and employee.
With respect to time, you should also consider planning performance over a more extended period than, for example, one day. Consider the planning performance over weeks and months. That way, you can see the trend. That trend is essential information for answering the question; are we getting better or worse in scheduling?
You should be able to reflect the planning performance, as shown in the following chart. The blue line represents the planning performance. As you can see, the graph also shows two bars. The green bars indicate the hours in line with what you scheduled. The red bars indicate the number of hours outside the planning. These are, therefore, the spent hours that you didn’t plan.
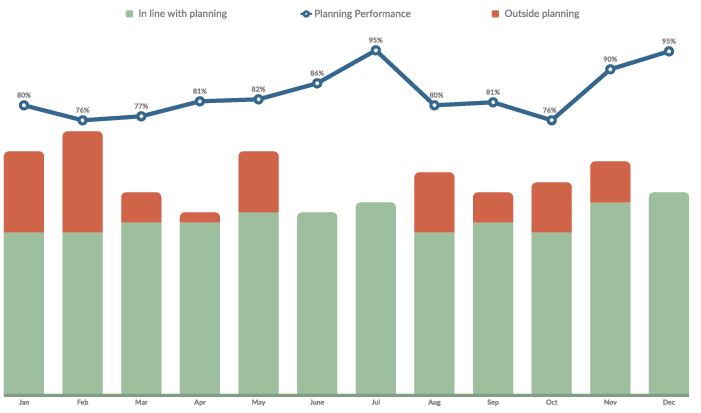
You can use this chart to see that, despite the slight dip in the months of August to September, there is a slightly rising trend in the planning performance. The hours out of schedule also give valuable information. You want to keep this type of hours as low as possible. These hours could also fall under overtime. The planning performance can still be quite high.
If you can make such a chart by department, project manager, employee, project, and others, then you have a potent analysis tool!