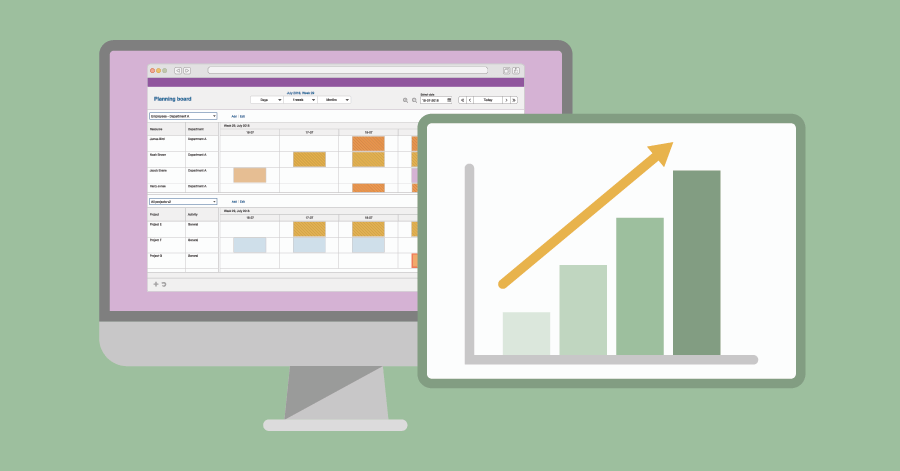
Is your organization getting better in planning?
Your gut feeling probably says yes, but how do you back that up? In this article, you can read how to measure the planning performance of your organization.
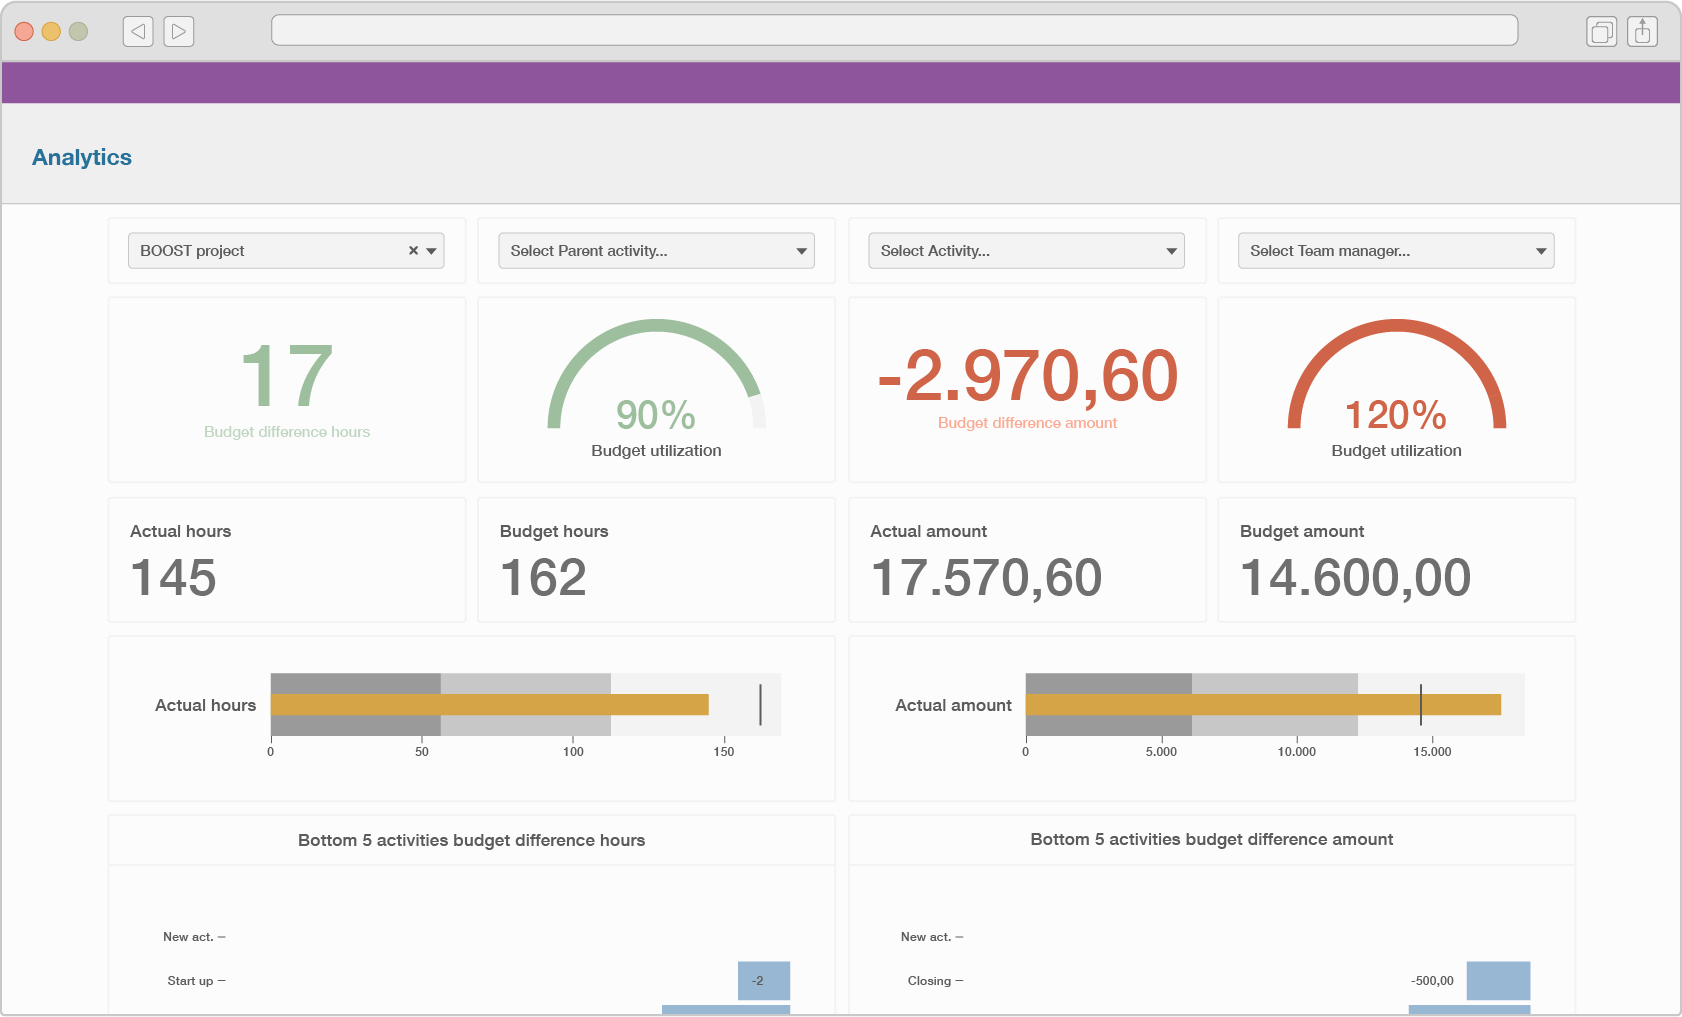
The analytics feature allows you to visually analyse project results with interactive graphs. This feature also ensures that everyone is presented with information in the same way. Just one version of the truth when it comes to your organization’s performance.
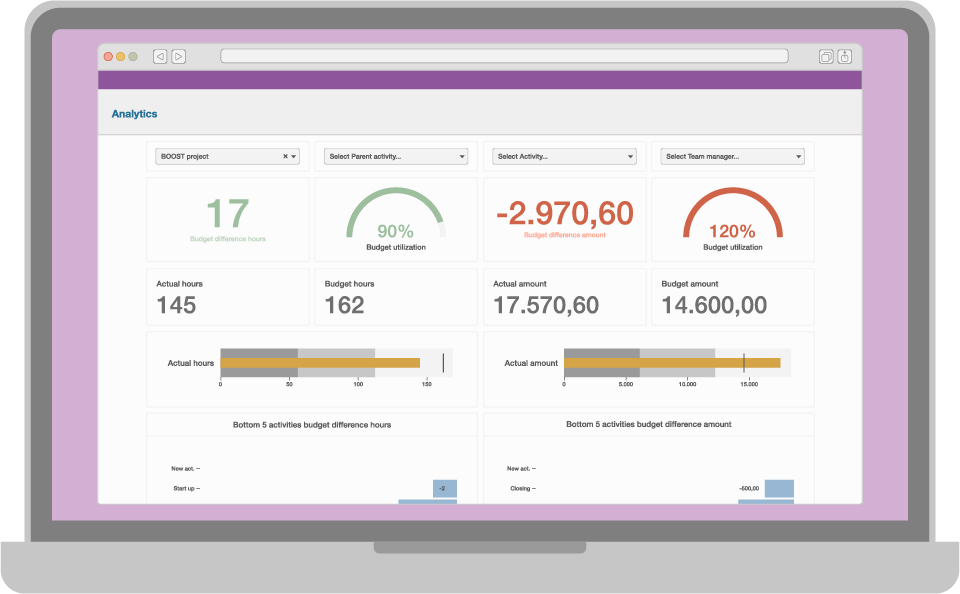
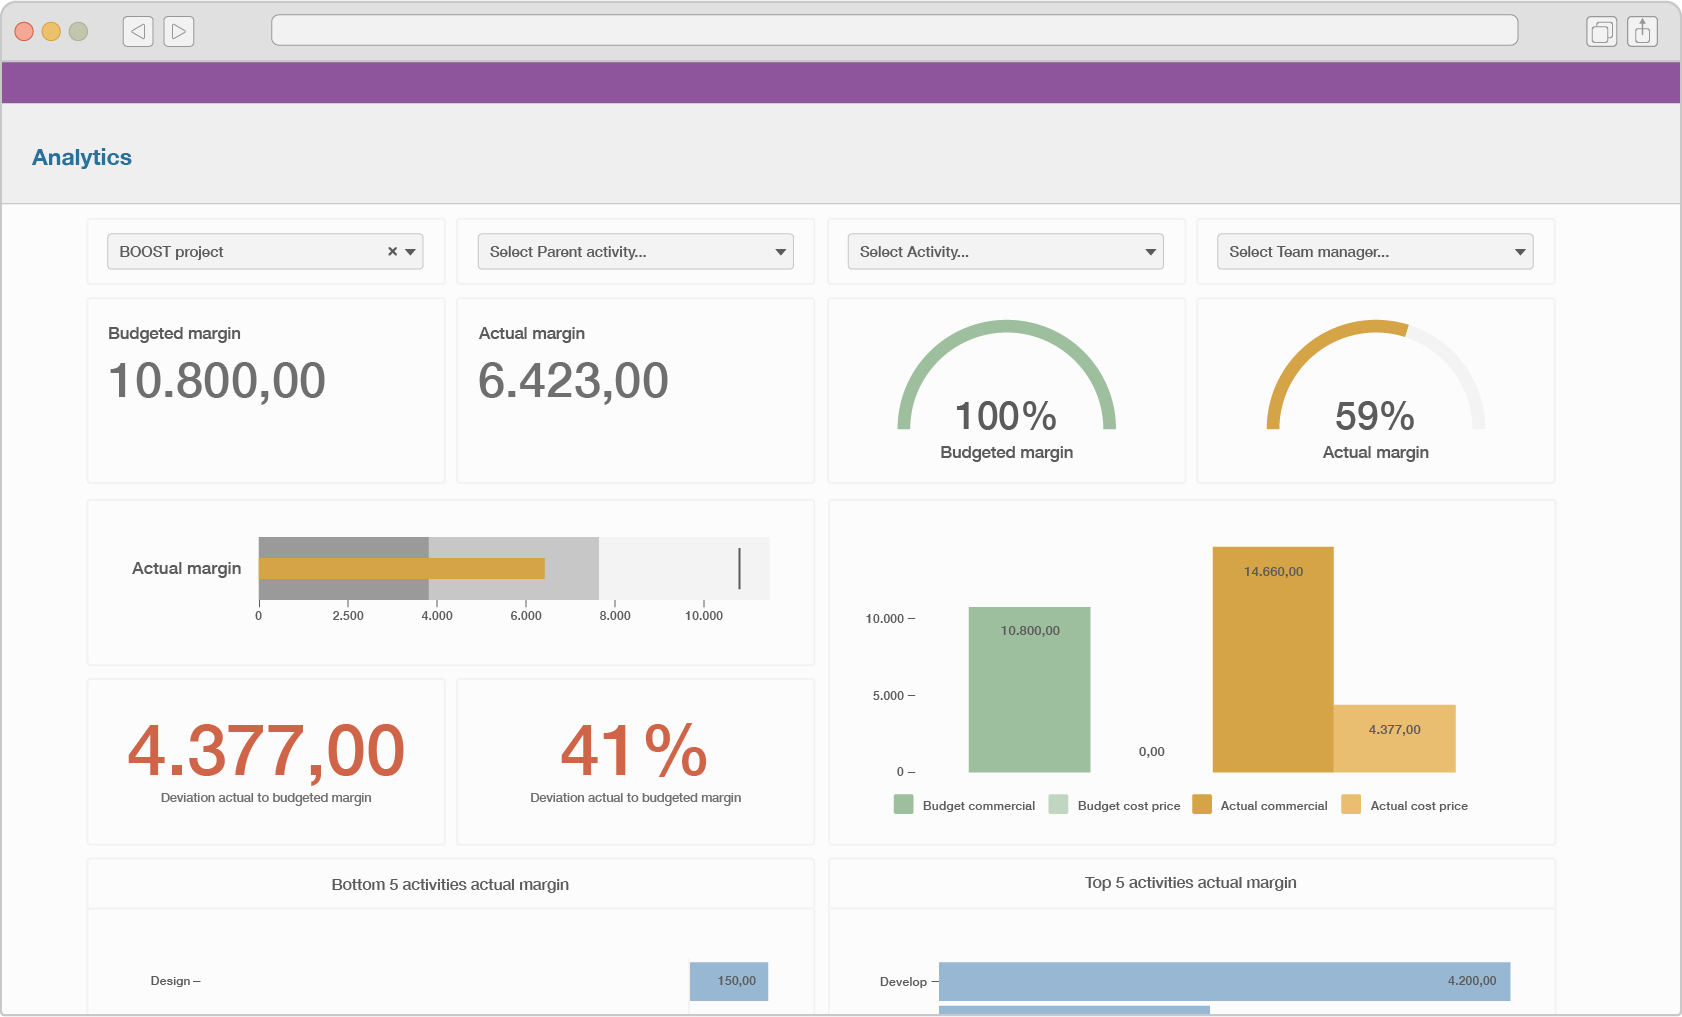
We have already done the hard work for you. Based on our experiences and feedback from customers, we have developed a library of best practice dashboards for specific purposes and industries.
They range from simple budget vs. actuals and productivity dashboard to dashboards where we do advanced forecasts and financial analysis of your projects. You simply pick the dashboards that you need.
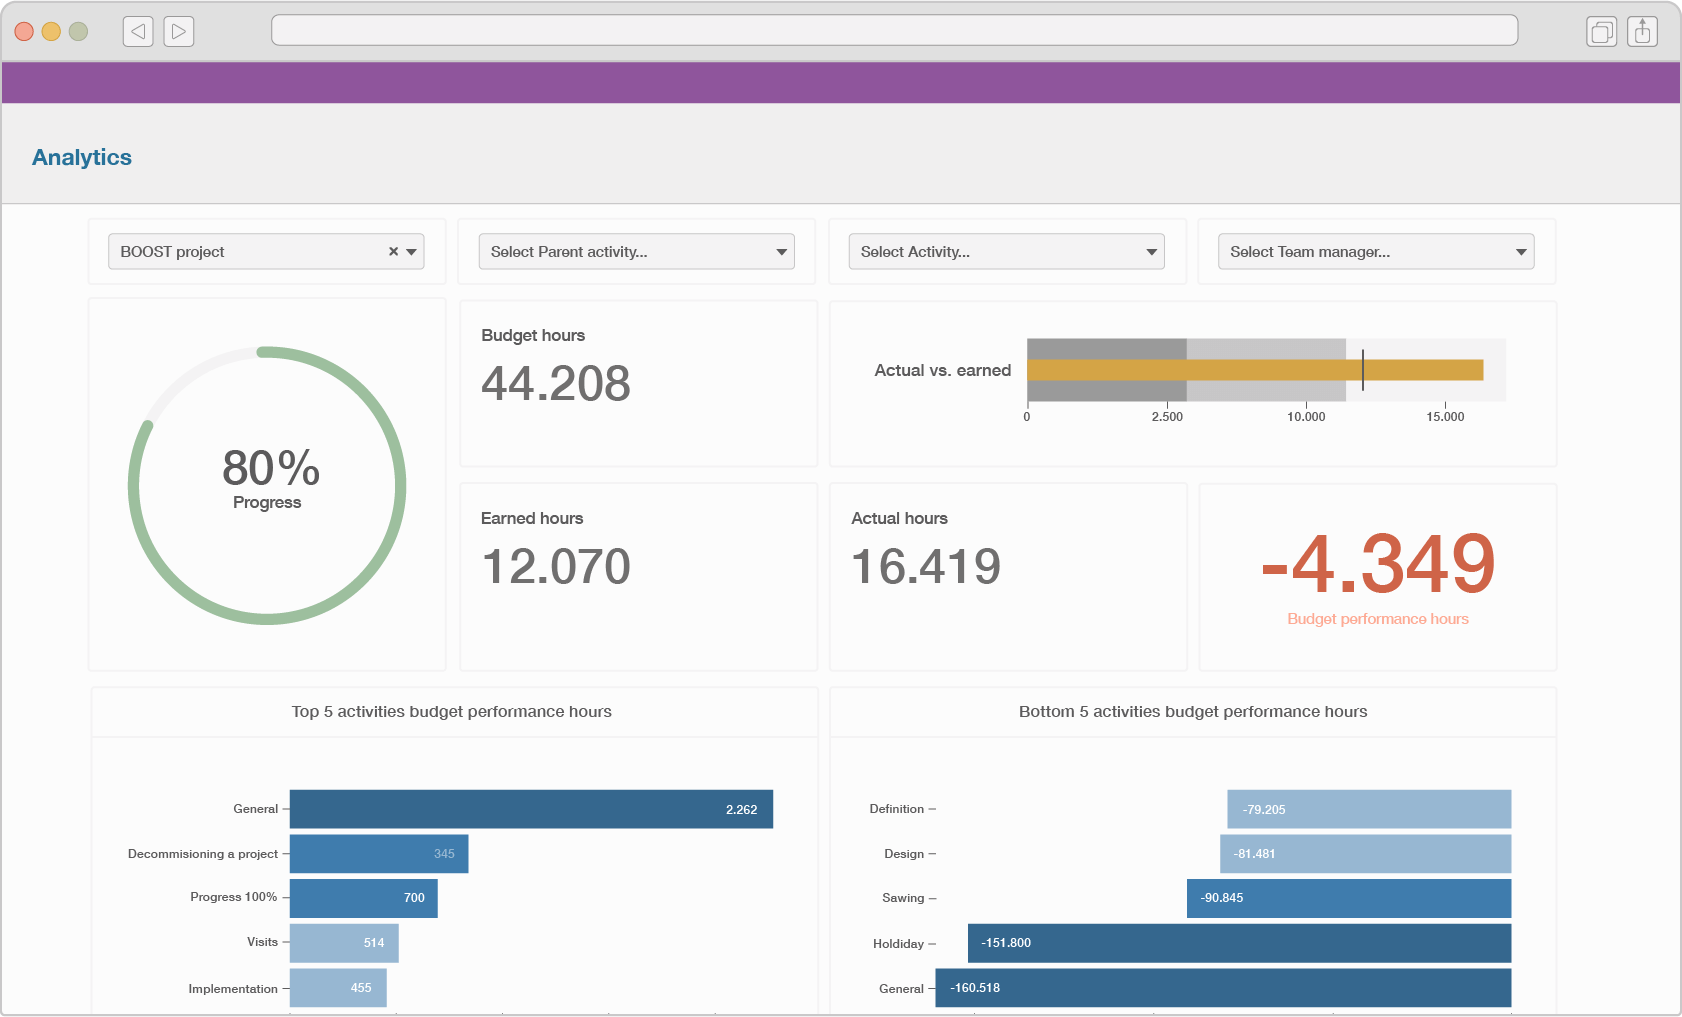
The power of our dashboards is in the visualization of the data. This will give you an instant understanding of how your company is doing because graphs will have you focus on what matters.
But we won’t stop there. We also feel it is crucial for managers and project managers to be able to play around with the data in an interactive way. You can click on graphs and switch metrics to drill down to the story behind the numbers and find the answer you are looking for.

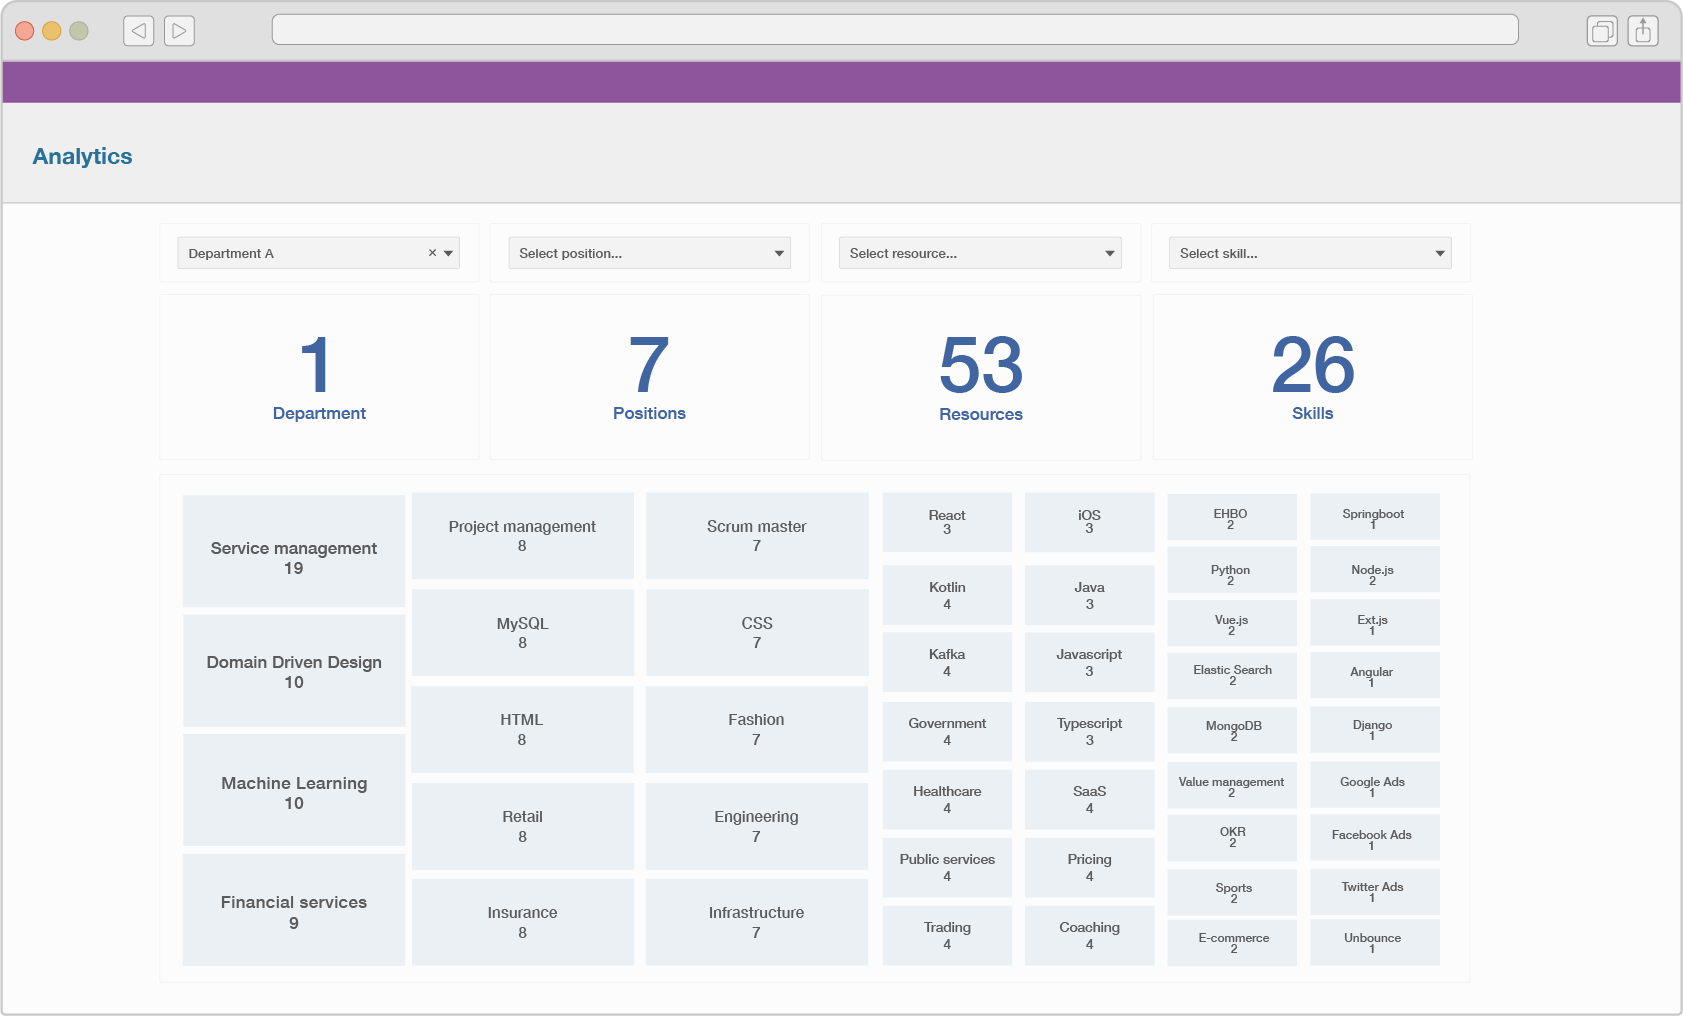
We have found the sweet spot between working with default dashboards and the need to customize them to your needs. We enable you to create your own variants of our default dashboards.
This way you can get rid of certain graphs and metrics that are not relevant to your business. You can change the layout and set initialization filters that make sense to you. You can also share your variants with other users within your company.
As with all other Timewax features, you can easily decide which users have access to the analytics feature. But we took it a step further, because data on your company’s performance is confidential and you should be able to control it very granularly.
For each user you can define which dashboards they are allowed to open and whether or not they can create their own variants. You can also set up data security to make sure they only see the data they are allowed to see.

Your gut feeling probably says yes, but how do you back that up? In this article, you can read how to measure the planning performance of your organization.
There are plenty of ways to analyze your projects. They are all useful but often focused on the past. So how can you look ahead to make timely adjustments to your project?
Despite the available progress information, almost half of the projects exceed the deadline and budget. So, unfortunately, the progress information is often inaccurate.
You can take an interactive tour, book a tailor-made live demo or even start a free trial. Just want some advice? Don’t hesitate to reach out to one of our planning experts for a free consultation.
SOLUTIONS
ABOUT US
CONTACT
Asterweg 19 D12
1031 HL Amsterdam
The Netherlands
CoC: 34241521
VAT: NL8157.72.609.B01