
Process
50% safety margins in project planning can go
You can reduce 50% of the safety margin in the planning. So that’s wasted time. If you cut this margin away, you can complete projects in three-quarters of the time.


You can reduce 50% of the safety margin in the planning. So that’s wasted time. If you cut this margin away, you can complete projects in three-quarters of the time.
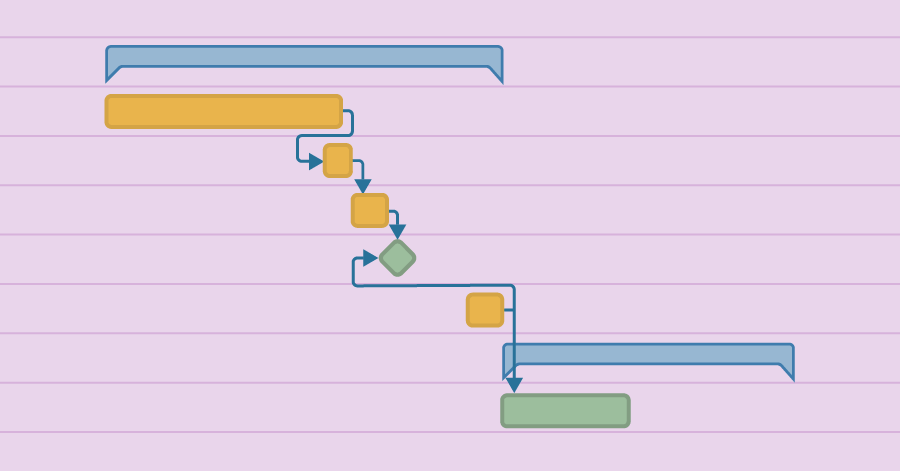
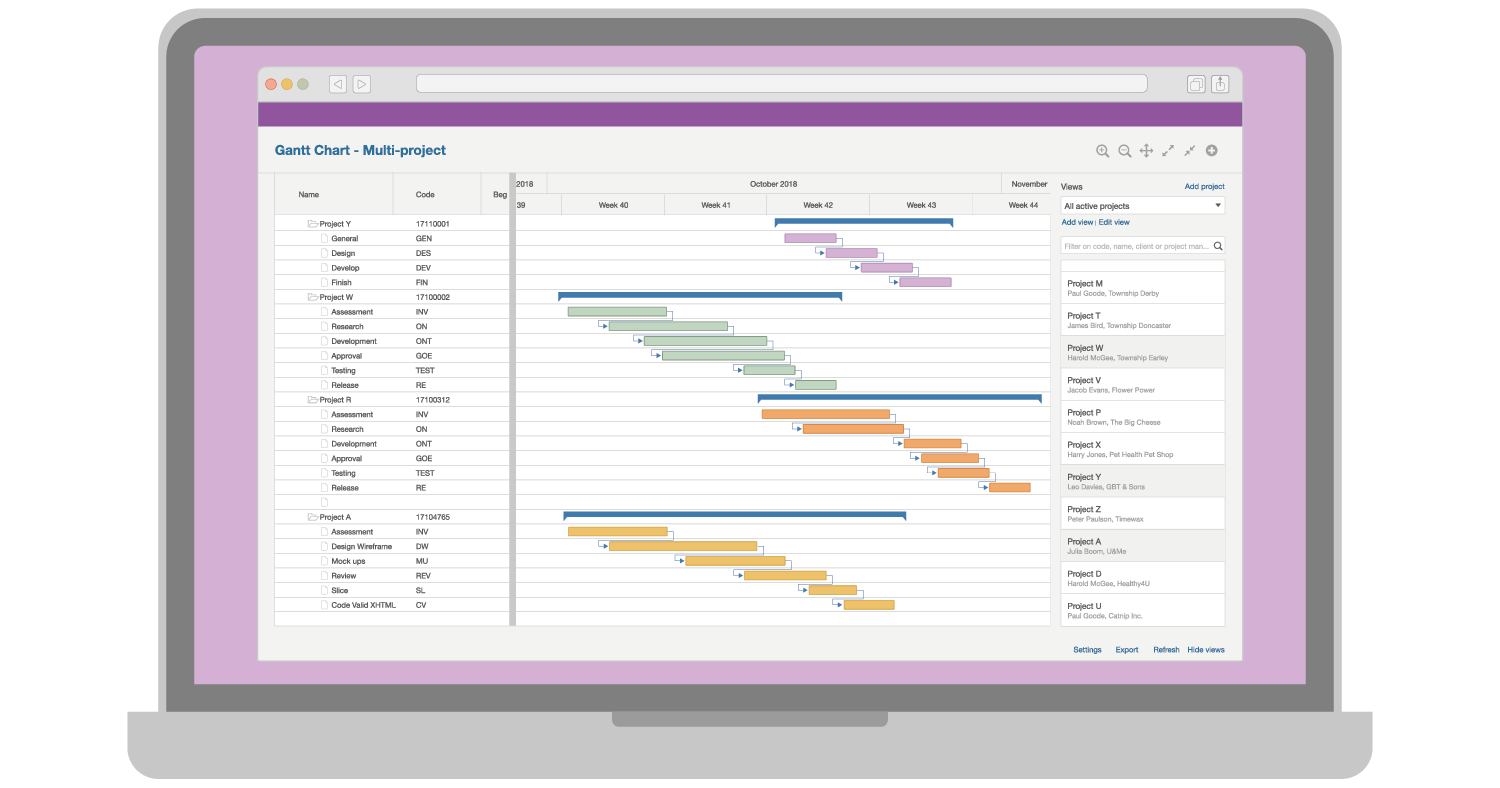
With a Gantt Chart, you graphically show the project planning. So when does it make sense to use a Gantt Chart, and when not? We will explain that to you in this article.

Parkinson’s law states that workers spread their work over the available time. Is your company also suffering from this? Do you know how to combat this unnecessary waste?
Asterweg 17A1, Amsterdam