
Organisation
Capacity planning vs. To-do planning
Companies reach out to us because they want to start scheduling. Some are looking for a planning tool to manage capacity; others want to manage a list of to-dos.


Companies reach out to us because they want to start scheduling. Some are looking for a planning tool to manage capacity; others want to manage a list of to-dos.

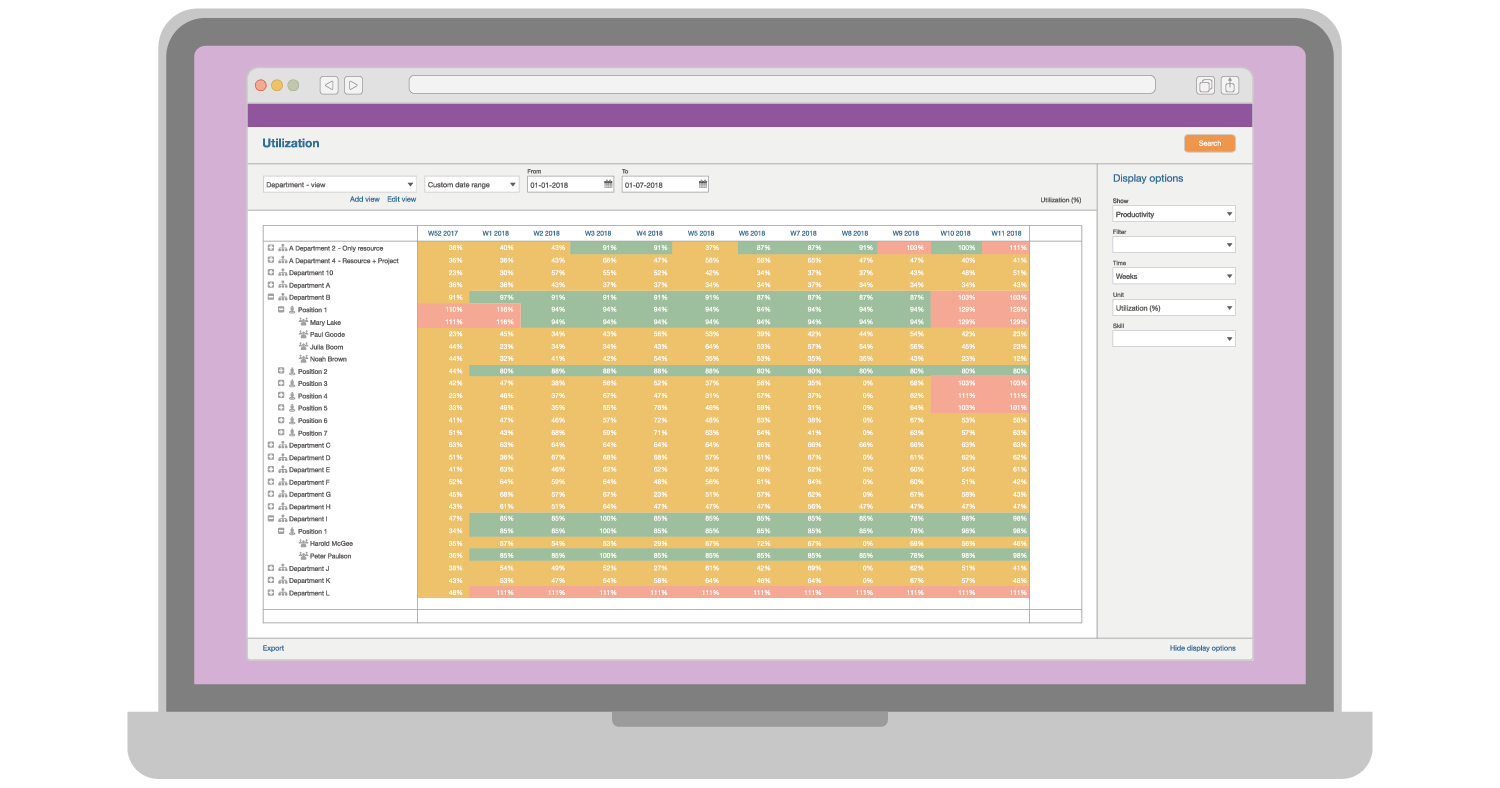
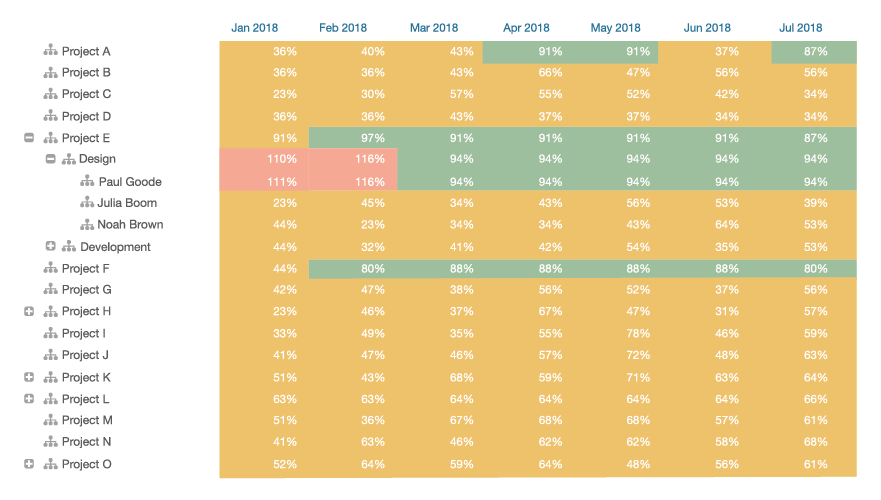
How can you have a well-founded discussion with, for example, management and the sales team with insights from the utilization rate? We will explain that to you.

How do you ensure that you keep track of all your leave requests? What should you do to keep your company running during the holidays? We’ll explain that in this article.
Asterweg 17A1, Amsterdam