Project & resource planning as a continuous improvement process.
Service providers who carry out projects for their customers generally want two things: on the one hand, a fast and satisfactory result for their customers, and profitability on the other hand. An optimal allocation of employees to the projects is crucial. Yet, we often see that project and resource planning is limited to a one-off activity at the start of the project. Shouldn’t more attention be paid to this?
Suppose you run multiple projects at the same time. New projects, scope extensions, and changed priorities can suddenly create a discrepancy between the required capacity and the available employees. That can be very annoying when you do not see it coming. Deadlines for customers are not met, some employees will get overworked, and other employees will start turning their thumbs down.
In this blog, we will look at how we can prevent these situations by planning projects and resources as a process rather than an incidental activity. We use Deming’s quality circle, a useful tool for optimising a process. This circle describes four consecutive steps that apply to all improvements in organisations and provides for better quality:
- PLAN
- DO
- CHECK
- ACT
To make it practical, I will describe each step below by means of a concrete example of a project-based service provider with a number of project managers and a resource manager. In this situation, the project managers set up the project plans and submit resource requests to the resource manager who coordinates resource planning through out the company.
1. Plan
Our service provider experiences bottlenecks in the project and resource planning. In this step, they create a plan that describes the problem and what improvement is desired. We translate this into goals that we also want to measure and for which we can define benchmarks and targets.
Problem
We are constantly being overtaken by events in projects. Only after the last moment we find out we need to allocate more employees or there are employees at our desk who have nothing to do in the coming period.
Desired improvement
We want to anticipate additional needed capacity in projects and foresee employees who run out of projects earlier. This enables us to guarantee the results for the customers and optimise employee utilization.
Measuring goals
The goal in our example is twofold:
- Ensure results to customers
- Optimal utilization of employees
These goals are not yet concrete enough. What is exactly what is meant by “ensuring results”? Is this meant a timely delivery, with a certain quality or maybe both? It is therefore important to clarify and make measurable in so-called key performance indicators (KPIs).
In our example, we assume that ‘delivering results’ is meant to deliver on time. We decide to express this with a KPI ‘Number of days exceeded’. The optimal utilization of employees is expressed as a percentage that employees work for customers in relation to the total number of workable hours. This KPI is called ‘Billable’.
Determining benchmarks and targets
Now that we have determined the KPIs, it will be time to determine benchmarks and targets. A zero measurement shows that the KPI ‘Billable’ was 75% on average last year. For the KPI ‘Number of days exceeded’, we see that we average 10 days late. These figures are now used as benchmarks.
An essential part of Deming’s quality circle is to determine the ambition. This is formulated by setting targets. For example we say that we want to decrease ‘Number of days exceeded’ to 5 days in 3 months and to 0 days in 6 months. We want to increase ‘Billable’ in the same timelines to 80% and 85% respectively.
2. Do
The implementation of the plan takes place in step two. This will carry out (new) activities that are important for achieving the goals. In the old situation, the project managers and resource manager only sat at the table at the start of the project and in case of issues. Now they decide to conduct a brief planning meeting every week on Monday morning, informing each other about project developments and resource planning.
Registering data
An important focus is the continuous recording of the data needed to determine the course of the KPIs. In the next step (Check), the effectiveness of the new process is measured and discussed. This can only be done when the data is available and reliable. Measurement brings knowledge and without good data we cannot manage the process effectively.
In our example, the company has a system for timekeeping. With the data from this system, the KPI ‘Billable’ can be calculated very easily. For the KPI ‘Number of days exceeded’ to date, there was no structural recording of the data. In addition we want to have a forecast for this KPI so that corrective actions can be taken in a timely manner. Each Friday afternoon, every project manager will update the progress for each project. Based on this, the project manager can issue a forecast on Monday morning during the planning meeting.
Supporting indicator
In the elaboration of the new process, project managers report weekly per project an additional indicator, namely the forecast planning variance (see blog 2 Killer KPIs for forecasting in projects). This indicator gives a forecast as to whether additional scheduling hours are required to reach the deadline or that the project may even prematurely return resources to the resource pool for the benefit of other projects. This gives a good view of the demand versus the available capacity across all projects.
3. Check
This step looks at whether the goal is achieved. The result of the improvement is compared to the original situation (benchmarks) and tested against the set goals (targets). This gives us an idea of whether we are in line with the proposed improvement. The project managers and resource manager decide to organise this step once a month, in addition to their weekly planning meeting.
A handy view to monitor performance is a line chart that shows you the progress, as shown below for the KPI ‘Billable’.
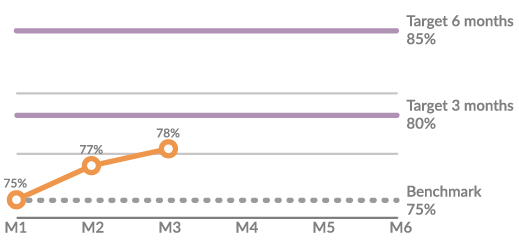
The development of the ‘Billable’ KPI is not on track. After 3 months, it should be 80% but it is stuck at 78%. In order to determine the right action, it is necessary to make a more detailed analysis of this KPI. For example, it may appear that there is one particular department or function group that reduces the overall average. Here, targeted action can be taken.
In the graph below, we see the results for the KPI ‘Number of days exceeded’ of six projects completed in the last 3 months.
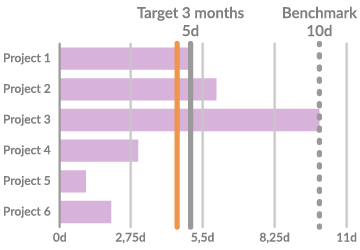
The orange line indicates the average number of days of overruns for these projects. This is before the target line of 5 days, so this KPI is on track. This chart also shows that especially project 3 affects the average in a negative way.
4. Act
In the previous step, the scores on the KPIs were discussed. In this step, the plan from the first step will be adjusted and refined if necessary. It is also checked whether the implementation needs to be adjusted.
Make improvements
In the first 3 months, the project managers and resource manager have experienced that it is quite difficult to allocate additional employees from within the organisation to projects that were in need of them. Everybody was fully utilized. They have solved this with external employees, but this has a detrimental effect on the margin on the projects.
Therefore, they now decide that the total utilization (total scheduled time) of a department or function group may not exceed 95%. In this way, they have a buffer of available hours that can be used ad hoc for projects that suddenly require additional capacity. Additional hours can be used from this buffer so that the promised deadlines can be reached at any time.
Adjusting benchmarks and targets
In the example we are midway through the course, namely at the end of the 3rd month. We still adhere to the benchmarks of the KPIs. These will only be revised after the 6 months drawn for the first iteration of the improvement process. The project managers and resource manager decide to adjust the target for the KPI ‘Billable’. In retrospect, this is defined too ambitiously and the target for over 6 months is now adjusted to 82%.
The target for the KPI ‘Number of days exceeded’ is maintained. After 3 months, this KPI was even on schedule, but it is expected that it will be somewhat more difficult to bring the average to 0 days in the next 3 months.
Conclusion
The power of a process approach is in the continuous attention that is being spent on a process. The quality of Deming’s quality circle is constantly improving. By gradually increasing the amount of goals with new targets, the project and resource planning is constantly professionalized, which makes the company’s performance ever better.
If we look at our example, you do not have to stop when ‘Number of days exceeded’ = 0 days has been reached. Then start again with a new target like -5 days, so we can exceed customers’ expectations and distinguish ourselves from the competition. In this way, a process-oriented planning process even contributes to a unique proposition.
In the outlined project planning process, I see as a prerequisite that the project manager must organise a constant feedback loop on the progress of project work. All employees must report progress at least once a week. To accept employee acceptance, it is important not to impose ‘accountability’ but make it clear to them that their feedback is used to improve the performance of the organisation.
Reporting on progress does not have to be that extensive. In our example, we can limit ourselves by only provide an estimation of the hours needed to complete the work. This is sufficient for the project manager to determine whether the deadline can be reached and whether sufficient capacity is reserved in the planning.