
The added value of cost price rates when planning projects.
For many organizations, they are only able to see in hindsight what the margin was they achieved for their project, which for many, leads to disappointment. The project ended not being as profitable as they had thought. Even while remaining within the budgeted number of hours. How is that even possible? An analysis showed that they, for example, relied on freelancers instead of internal staff on which the project was budgeted. Or that more senior employees were used, disproportionately, which is more expensive than junior employees.
In this blog post were are going to take a look at how you clearly see how the margin will develop during the delivery of the project. This will allow to make timely adjustments or to manage your expectations. A crucial tool that we will utilize is the use of cost price rates. We will first explain what a cost price rate is, then will identify the cost components, and finally we will illustrate all of this through a calculation example.
What is a cost price rate?
The commercial rate is the rate that the customer for your service is charged per hour. The cost price rate determines the cost of that service. The difference between the commercial rate and the cost price rate is the margin (profit). If you work with cost price rates then you can easily analyse the margin per project, customer, employee, job, etc.
This provides for some interesting insights, for example, you will be able to see that some customers are very much worth your time, while others are not. You can also appeal to project managers and department managers to focus on the profitability of a project. Staying within the budgeted hours only is not enough. They need to make sure the project, and thus the company, is profitable. In addition, insight in the profit margins is great input for adjusting the commercial rates and controlling costs.
Does it always make sense to use cost price rates?
I can think of one situation in which it makes no sense. At a small company with one department, with employees of the same (salary) level and a homogeneous service which is delivered to customers based on actual costs (time material). The cost for each project and employee is the same. Even though the budgeted hours are exceeded, the costs are always fully covered, because it is based and calculated on actual costs.
If the same company is also working on the basis of a fixed price, then the use of cost price rates is already interesting. They can then see exactly what effect exceeding the budgeted number of hours will have on the margin for the project. They cannot charge more than the fixed price. That gives good input for the redirection of the project.
Cost components of the cost price rate
Variable versus fixed costs
For projects you can distinguish between variable and fixed costs. Variable costs are costs that are specific to the project. So, for example, the purchase of a product or a service. These variable costs are charged one to one to the customer. This forms the purchase value of the project and does not have to be included in the calculation of the cost price rate.
Fixed costs are costs incurred regardless of the project. This includes staff labor costs, accommodation, and other general expenses. Many companies now make use of freelancers. Should those costs be regarded as variable or fixed? That depends. If you are hiring a freelancer specific to one project, then that would be a variable cost. However, if you have an ongoing commitment with freelancers as part of your personnel file, then you need to consider these as fixed costs.
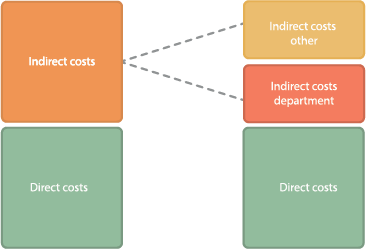
Fixed costs: direct and indirect
With fixed costs there will be distinction made between direct and indirect costs. The direct costs are the (wage) costs of employees and freelancers you hire structurally. These costs we label as ‘direct’ because the employees spend hours on projects and that way we can make an allocation to these projects. The indirect costs are then, by definition, all of the other fixed costs.
For a business with one department, you will see that you are working with only one surcharge for the indirect costs. For larger companies with multiple departments, it is possible attribute indirect costs to specific departments. Consider, for example, housing costs that you can divide by the number of square meters per department.
Allocation by productive hours
A cost price rate is expressed as cost per hour. After the fixed costs are determined, they should be allocated to hours. To do this, you use the number of productive hours per year. Productive hours refers to the number of hours an employee works on various projects. You will want to exclude holiday time, sick leave, and hours spent on internal work. Often times you can determine this based on historical data. In addition, you will need to adjust this to the forecast for the coming year.
As a rule, you determine the cost price rate for each position in the company. You will see that the cost price rates for each position will be different, not only because the cost per postion varies, but also because senior employees are more productive than junior staff. Junior staff will incur more training hours than senior staff and will have less productive hours as a result. This is also reflected in the cost price rate.
Calculation example
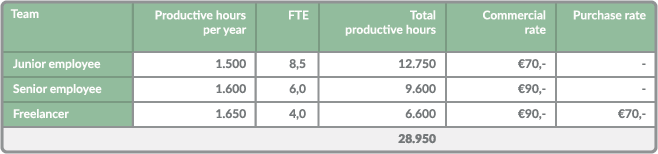
As an example, we will take a small ICT company that wants to work with cost price rates for the following year. They have junior and senior employees. In addition, they work with some freelancers, at an average rate of €70.
The table below shows the expected composition of the team. Based on historical cost figures, there is an estimate of the expected productive hours. In the ‘FTE’ column, the average number of FTEs is included. The expected in-and outflow of employees is also taken into account.
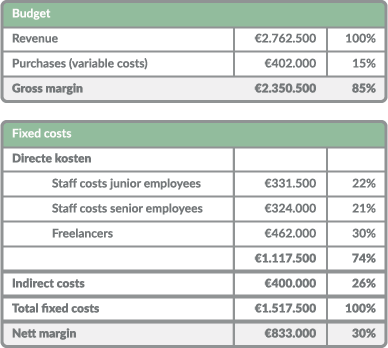
Furthermore they have created an estimate of revenue and expenses for the coming year (Figure 3). During peak times they expect to hire additional freelancers, but this will be purely on a project to project basis. These variable costs are charged one to one to the customer. Thus, these costs are recorded under ‘purchases’.
Labor costs and the costs for the freelancers that are hired on an ongoing basis, are recorded separately. These are the direct costs we want to accrue in the cost price rate per position.
We now have all data available to calculate the cost price rate for each position. We will use the productive hours per postion as the key. In the table below you can see the cost price rate split into both direct and indirect costs.
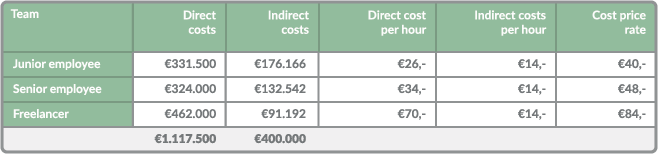
This provides insight into how much impact freelance hours have on the margin. At first glance, you would think that the margin between the commercial rate of €90 and €70, the purchase rate, is reasonable. However, the surcharge for the indirect costs of €14 has still not been taken into account here. The margin on a freelancer is therefore only €90 – €84 = €6.
What can we do with this information while planning projects?
Imagine that this company took on a project, Project X, and for this project, a fixed price is agreed to. This fixed price is based on a certain distribution of hours needed between junior and senior employees. See the table below.
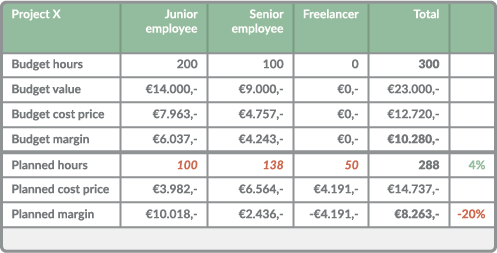
It is quite early, at the start of the project, for there to be a different distribution of hours. They want the junior employee to a large extent to work on another project. However, this creates a gap of about 100 hours. They decide to divide this gap among a senior employee and a freelancer. They need even less hours in to complete the project, but you will now see that the margin on the project decreased by 20%.
Maybe with the knowledge you have now you would have come to a different decision. Or maybe not. It’s possible that with the junior employee working on another project you would have gained more margin than what was lost in this project. In any case, you would be able to make a more informed decision with this type of insight.
A simple weekly report coming from an analytics tool, including all current projects and their planned margin would be a great management tool. Senior management will directly see how the margin is effected from project to project. This will allow them to level off staff across projects based on the most optimal margin for the company. In other words, it allows you to start planning your projects based on their margin.