In a service-oriented organization, success largely revolves around people. Employees provide the knowledge, expertise, and hours that form the basis for revenue and margin. Therefore, it’s crucial to have a clear understanding of the relationship between an organization’s earnings and the number of people it needs to achieve them.
One of the most insightful KPIs for this is “revenue or margin divided by the number of FTEs.” This KPI essentially tells you how much revenue or margin you generate per full-time employee, providing immediate insight into your organization’s efficiency. It also helps you compare efficiency with your industry peers and get a sense of how well you’re performing compared to others.
In this article we will discuss how to use this KPI from three angles:
- Revenue versus margin
- Actuasls versus forecasts based on planning
- Internal, external or total number of FTEs
1. Turnover or margin: which figure do you choose?
The first choice you have to make is whether to calculate the KPI based on revenue or margin. Revenue per FTE provides a general picture of the organization’s productivity. It shows how much income is generated by the efforts of your people.
Margin per FTE is often more valuable to operations managers because it takes costs into account. Ultimately, it’s not just about what you earn, but what you have left after expenses.
When calculating a KPI based on margin, it usually refers to gross margin: revenue minus direct costs, such as hiring external staff, travel expenses, or project-related licenses. Indirect costs—for example, management, administration, or housing—are generally not included because they cannot be directly attributed to specific projects.
By using only direct costs, you get a clear picture of operational efficiency. You see how well projects are performing and how effectively your capacity is being utilized, without fixed costs distorting the picture. This approach also makes the KPI more comparable across teams and time periods.
However, it can be useful to partially include indirect costs when looking at overall business efficiency. Rising overhead can, after all, reduce profits, even if the margin per FTE appears stable. Many organizations therefore use both perspectives: gross margin per FTE for operational management, and net margin per FTE (including allocated overhead) for periodic financial evaluation.
Many organizations start with revenue per FTE as a simple benchmark. But as the organization grows and the cost structure becomes more complex, the focus often shifts to margin per FTE as a more reliable indicator of efficiency.
2. Actuals versus forecast based on planning
A second dimension is the difference between the actual KPI and the expected KPI in the future. By looking back at previous periods—for example, monthly or quarterly—you gain insight into how efficiency is developing.
If revenue or margin per FTE increases, you know you’re creating more value with the same number of people. A decrease in KPIs often signals that processes have become less effective or that capacity utilization is suboptimal.
This KPI becomes even more valuable when you link it to your resource planning. By looking ahead based on planned projects, staffing, and rates, you can create a forecast for the coming months or even the entire year.
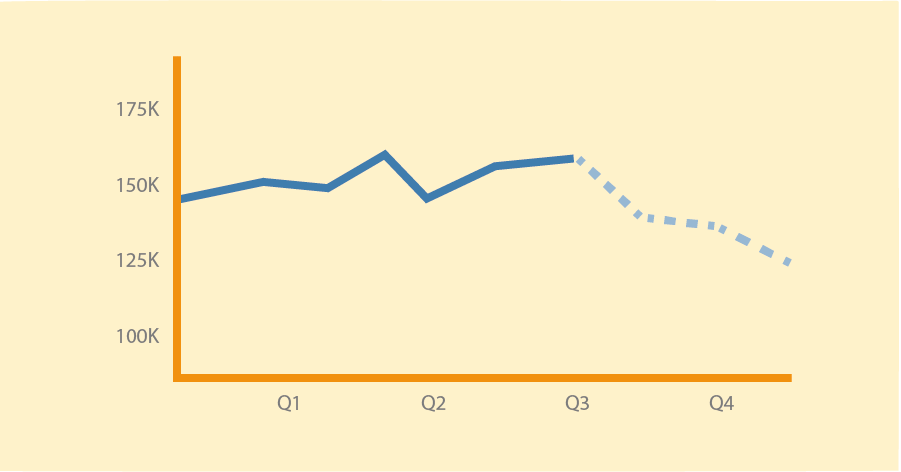
Example
A consultancy firm sees its planned margin per employee decline in Q4. This appears to be due to the increased scheduling of external staff, which is having a negative impact on project margins.
The difference between actual and planned KPIs is essential for proactive management. If you see that the expected margin per FTE is under pressure, you can, for example, reprioritize projects, revise customer rates, or adjust the deployment of external resources.
3. Internal, external or total number of FTEs
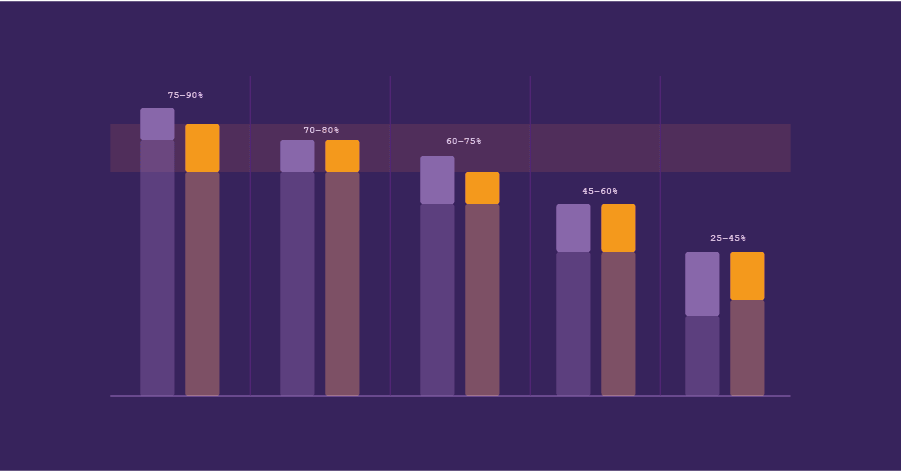
Not every FTE contributes to the KPI in the same way. Therefore, it’s helpful to distinguish between internal, external, and total FTEs.
- Internal FTE : Your organization’s permanent employees. This group forms the core and often determines the organization’s culture and stability.
- External FTEs : Contracted specialists or temporary workers. They can be a flexible way to handle peak demand, but are often more expensive per hour, which impacts margins.
- Total FTE : The sum of internal and external capacity. This provides the most complete picture, especially when considering the output of the entire company.
For a clear picture of efficiency, it’s wise to monitor all three perspectives. This reveals, for example, whether profitability is primarily driven by internal teams, or whether external forces are negatively impacting the margin per FTE.
For external FTEs, it can be helpful to distinguish between a permanent, flexible workforce and one-time external hires. You want to be able to plan the permanent, flexible workforce as resources, while accounting for the costs of one-time external hires directly as expenses.
Why this KPI is important for operations managers
Operations managers at service providers face the challenge of delivering projects on time and profitably, while often dealing with fluctuations in capacity supply and demand. The KPI of revenue or margin per FTE helps them:
- Identifying trends : By monitoring the KPI over time, it becomes clear whether the company is becoming more efficient as it grows.
- Better capacity planning : Linking the KPI to resource planning enables decisions to be made about hiring or downsizing staff.
- Making strategic choices : For example, shifting focus to projects with higher margins or limiting dependence on external hiring.
- Strengthen communication with management : A simple ratio such as margin per FTE is a comprehensible performance indicator for management and shareholders.
It’s important to measure frequently (monthly or weekly) and consistently to identify trends early on. Separate teams, for example, because a consultancy team can have a much higher margin per FTE than a support team. Use the KPI not just as a reporting metric, but as a starting point for improvement initiatives, such as process optimization, pricing strategies, or employee training.
Conclusion: efficiency as a competitive advantage
For service organizations, the KPI revenue or margin per FTE is more than just a number: it’s a compass for the organization’s efficiency and profitability. By monitoring this KPI over time, linking it to forecasts based on planning, and distinguishing between internal and external capacity, operations managers gain the insights they need to future-proof their organization.
In a competitive market, the difference between growth and stagnation can depend on how effectively you deploy your people. This KPI helps you understand that difference—and manage it accordingly.