Try asking yourself this question about your own organization. Of all the people who appear in your schedule—how many of them are actually involved in planning? How many create the schedule, monitor progress, and assign tasks? The rest are scheduled, but they don’t do the planning.
Most people we ask that question tend to guess low. Five percent, maybe ten. It makes sense: planning is something only a small group of people does, right?
The figure in our data is significantly higher. At the average organization that uses Timewax, About one in five people in the system has a planning role — planner, project manager, or manager. One in five, not one in twenty.
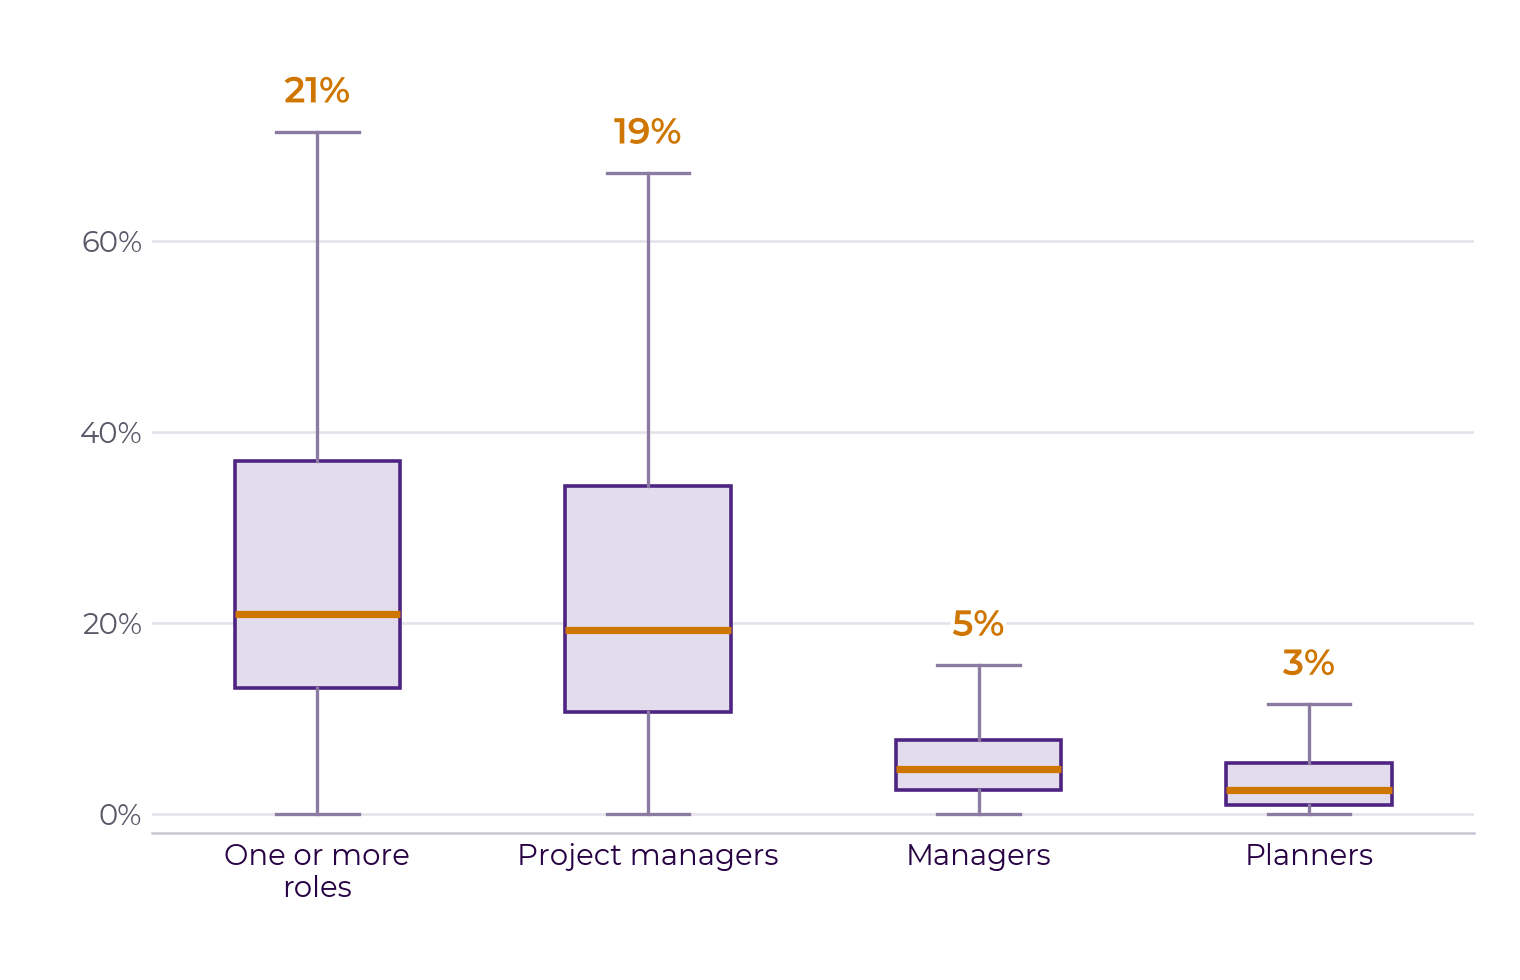
Figure 1: Distribution of roles involved in planning
Here’s how to read this chart: line up all the organizations from lowest to highest. The orange line will then be exactly in the middle—half are below it, half are above it. The purple box covers the middle half: a quarter of the organizations fall below it, a quarter above it. The thin lines show how far the rest extend, with the exception of a few outliers.
What immediately stands out in that chart is not so much the height of the orange bars but the height of the boxes. There is no “normal.” In a quarter of the organizations, less than 13% of the people hold a leadership role; in another quarter, it’s more than 37%. That’s a difference of nearly a factor of three between two organizations that are both perfectly normal.
Most of those one in five are project managers. Managers and independent planners together make up a much smaller group. That in itself is quite revealing: if you feel that “planning” is the sole responsibility of one or two people working in isolation, then you’re probably at the lower end of this distribution.
What happens when you grow
What’s more interesting than the average is what happens to that percentage as organizations grow. There are two very different stories here. Start with the managers. Their share is falling sharply.
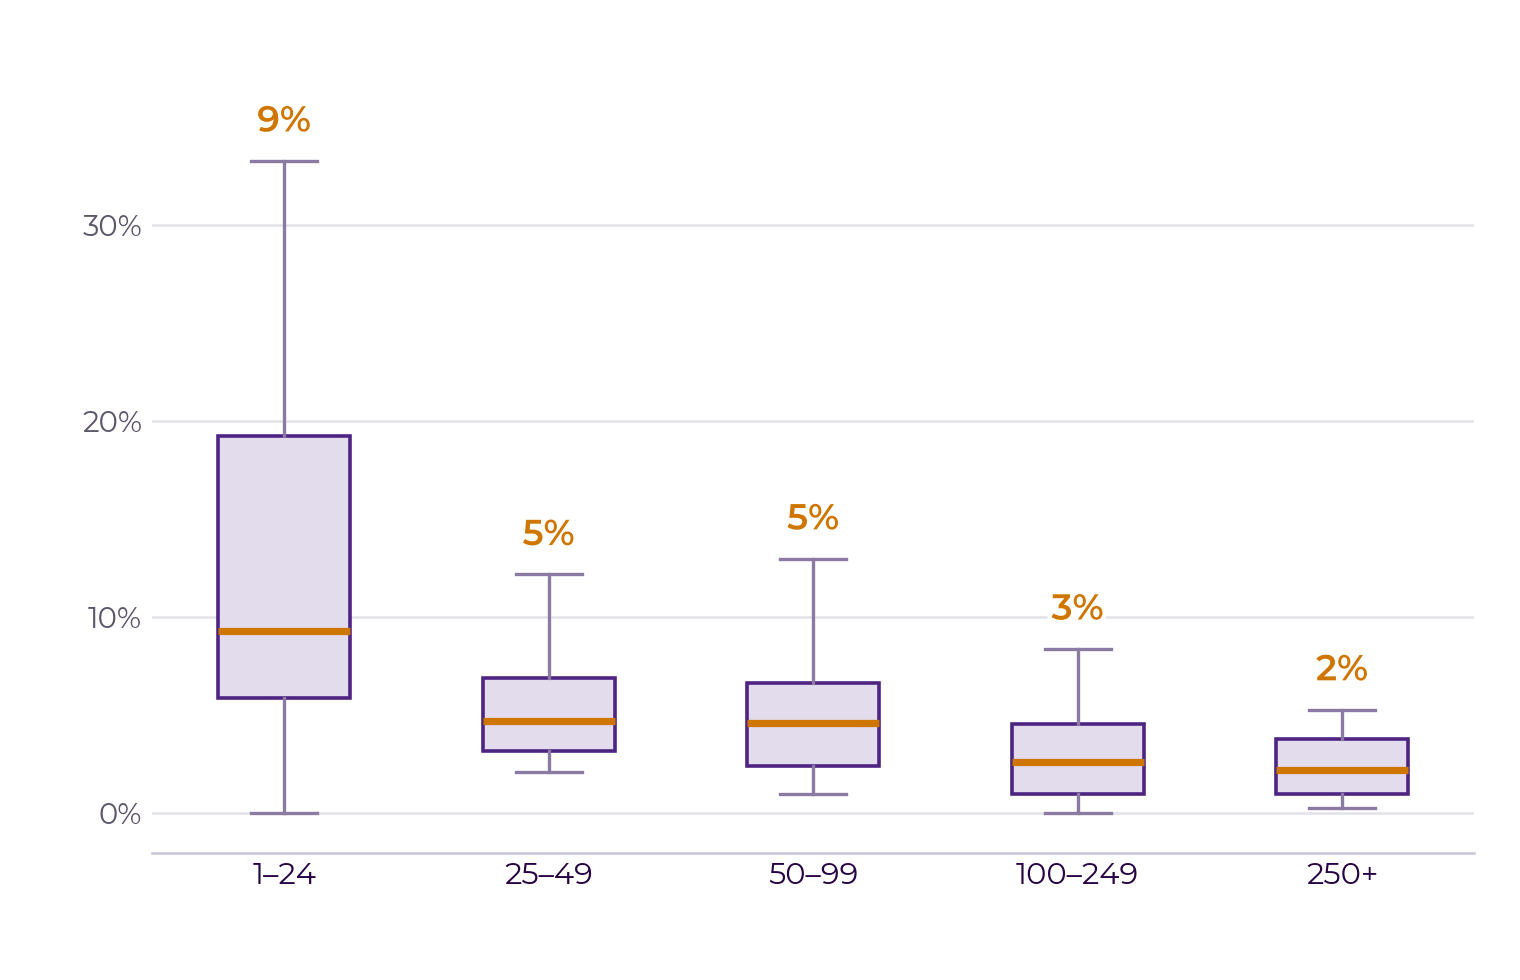
Figure 2: Distribution of the number of managers by organization size
The horizontal axis shows the number of employees in the organization. In the smallest organizations, about nine percent of the people are managers. In the largest, that figure is only two percent. That’s nearly one-fifth of what it used to be, and the pattern is visible at every step: it drops, and drops, and drops. This is exactly what you’d expect from a hierarchy. A manager can only supervise a limited number of people, but as an organization grows, the layers become thicker rather than more numerous. So, per person, you need fewer and fewer managers.
Now, the project managers.
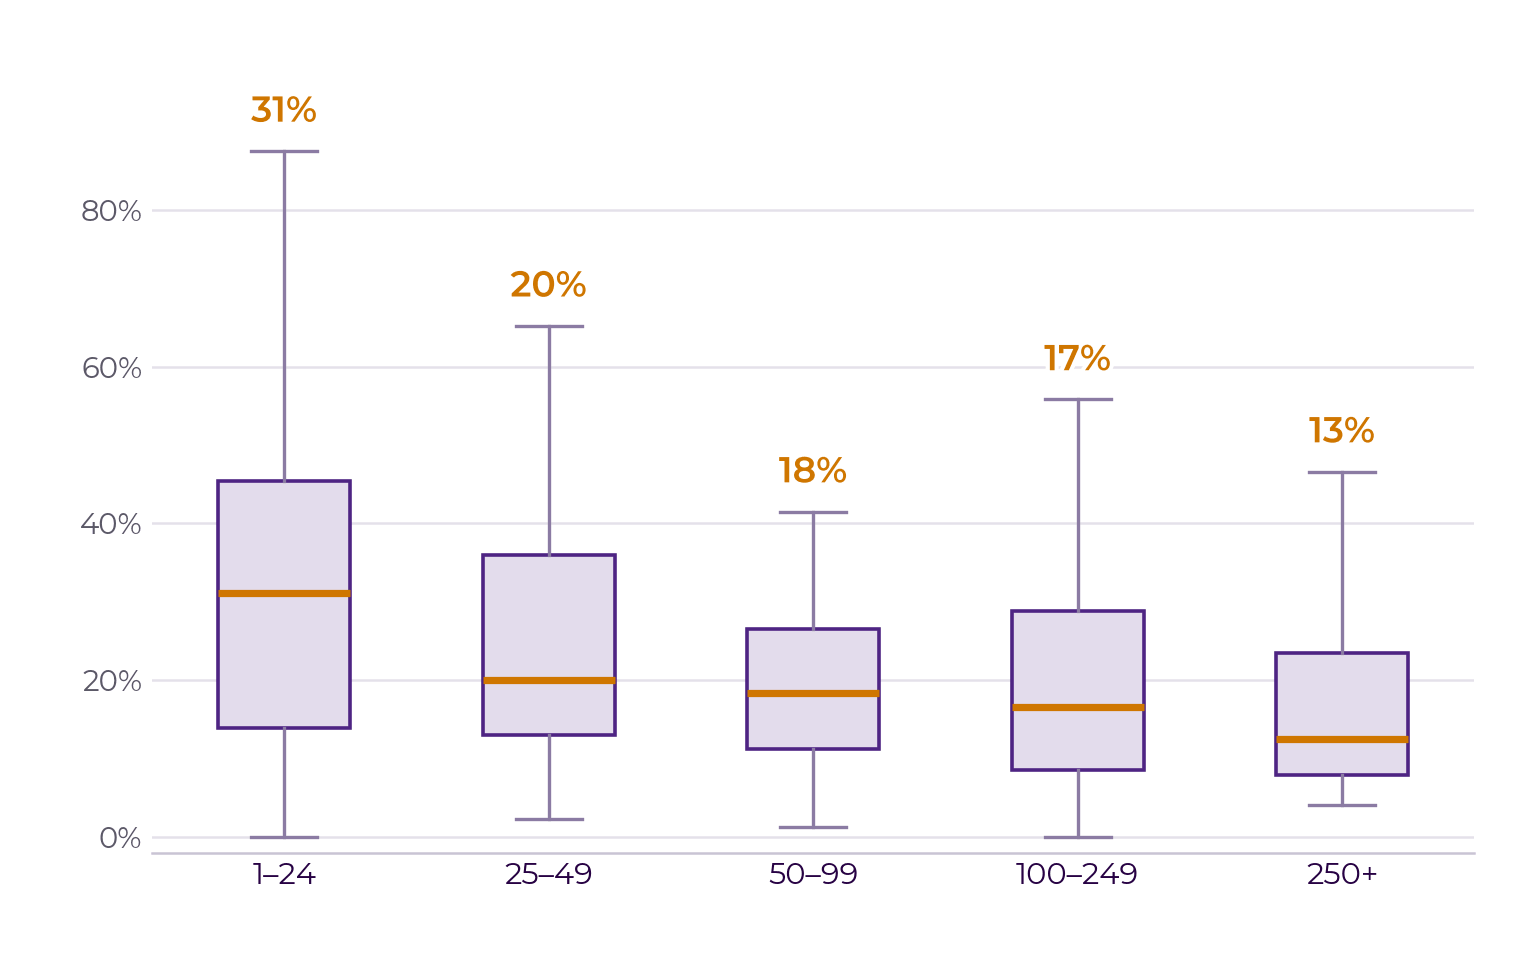
Figure 3: Distribution of the number of project managers by organization size
Here, too, you can see a decline, from about 31% to 13%. But look at the bars: they’re so tall and overlap so much that, to be honest, you can’t really draw any firm conclusions from this chart. An organization with fifty people and one with five hundred could very well have the same proportion of project managers. Whereas the management pattern is clear and consistent, this pattern is weak and messy.
And that difference is precisely what the story is about. Put the two side by side, and you’ll see that the number of project managers per manager keeps increasing: from just over three in the smallest organizations to nearly six in the largest. The ratio is shifting—and it’s shifting in only one direction.
What this means is: As an organization grows, coordination work shifts from the hierarchy to the project structure. You don’t end up with more managers per person—you end up with roughly the same number of project managers per person, and they take over the work that, in a small organization, would naturally fall to the boss. In a large organization, the person who coordinates what happens and when is much more likely to be someone in charge of a project than someone in charge of a department.
That’s no small shift. It changes where planning decisions are made, who is authorized to make them, and through which channels they are communicated. And it happens gradually, so usually without anyone actually deciding to do so.
And what about the industry you are in?
The obvious next question: Does this vary by industry? Does an installation company operate differently from an accounting firm?
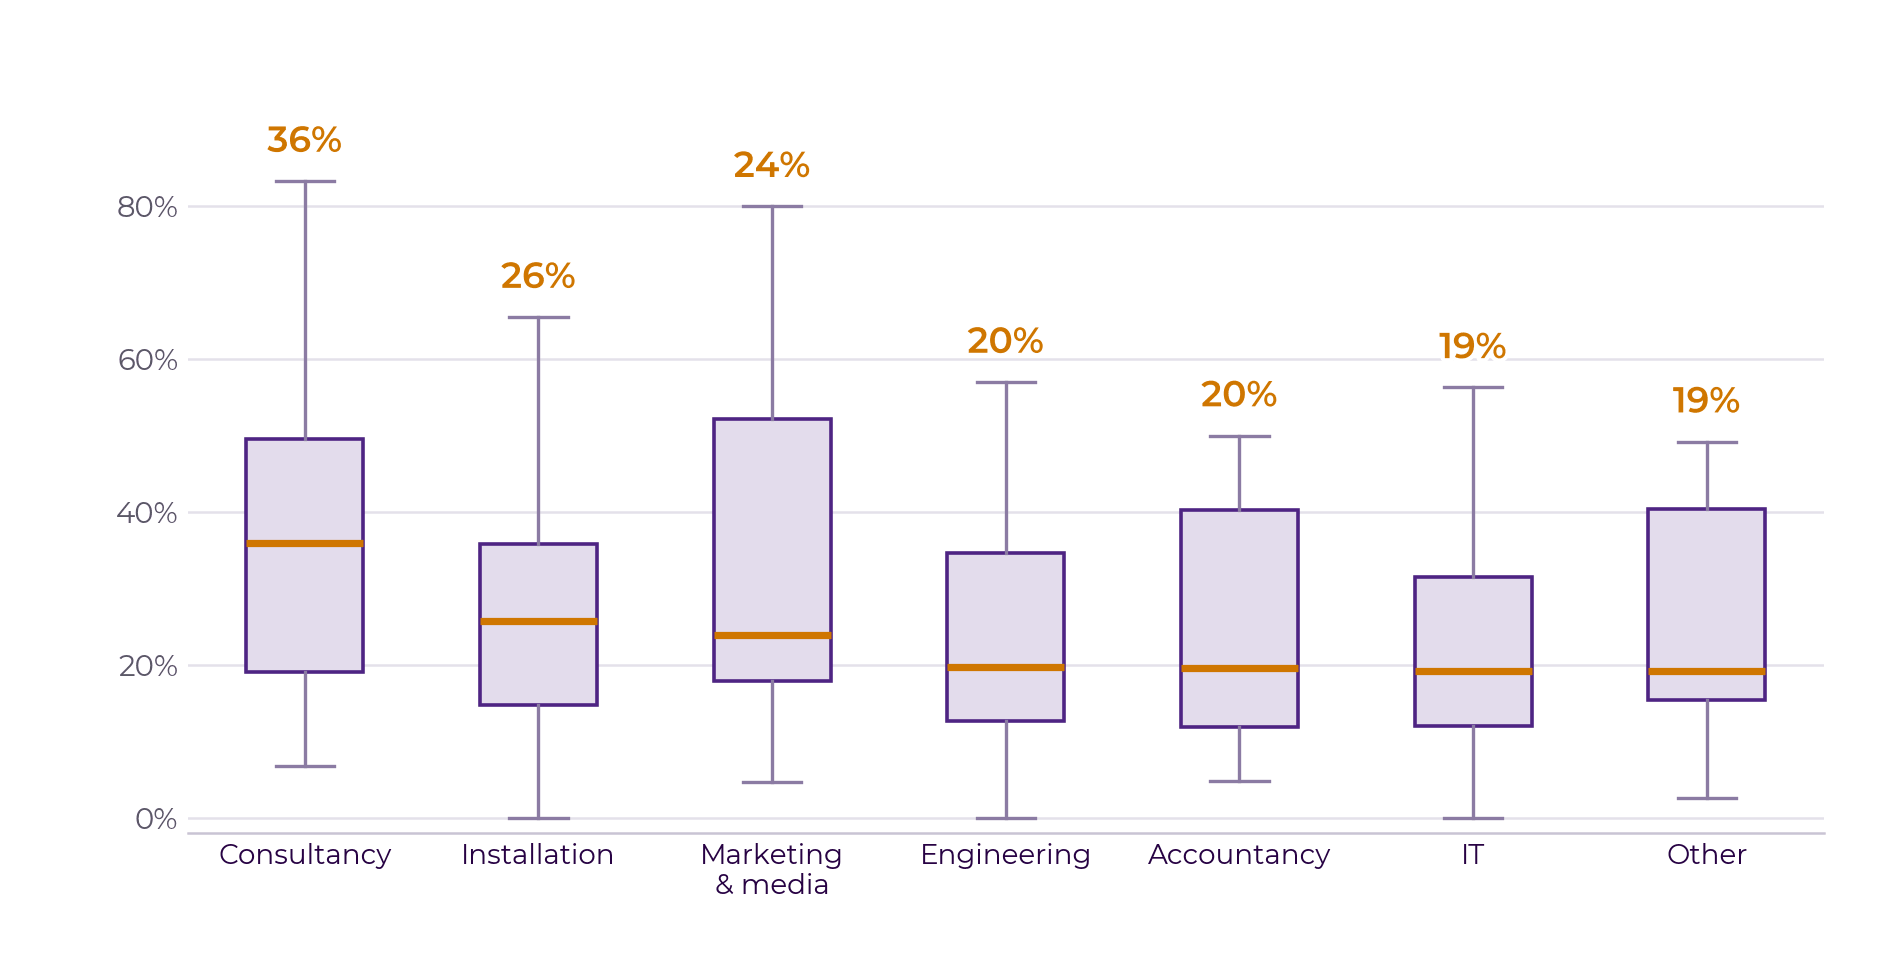
Figure 4: Number of planning roles by industry
The honest answer is: much less than you might think. Look at the orange bars, and you’ll see a series that largely hovers around the same level, with bars that overlap almost completely. For most industries, the difference from the rest is too small to be significant.
All but one. Consultancy really stands out. There, more than a third of people have a planning role, and that difference remains even when you account for the fact that consulting firms are smaller on average. That’s not surprising when you think about it: at a consulting firm, the work itself is organized on a project basis, and almost everyone is responsible for the progress of a project at some point. The line between “I execute” and “I manage” is blurrier there than elsewhere.
Other than that, the main lesson is: don’t blindly benchmark yourself against your own industry. The distribution Within any given industry is much greater than the difference between industries. Your neighbor in the same industry says less about you than you might think.
What can you do with this?
Three practical things.
First of all An expectations check. If your share of planning roles is well below 13%, the planning workload is likely concentrated among too few people—which creates vulnerability if even one of them goes on vacation. If you’re well above 37%, the question is whether responsibilities have perhaps been distributed too generously and too decentralized. Do you still have sufficient control and oversight at the central level? It might be time to centralize more.
Second, A growth check. If your organization has grown significantly in recent years and the proportion of managers hasn’t decreased accordingly, then you’re still operating with a coordination structure that was designed for your previous size. Conversely, if the proportion of project managers has indeed decreased, there’s a good chance that coordination tasks have been left undone.
Third, A layout check. Roll in resource planning software These aren’t just administrative details—they determine who is authorized to make changes and who receives notifications about what. If you don’t know how that division of responsibilities works in your organization, that in itself is an answer.