Billability – the percentage of available work time billed to clients – is the KPI to focus on for many IT companies, technical service providers, accounting firms and consulting firms. But what actually constitutes good billability? The answer you hear most often: “somewhere between 75 and 85 percent.” And that often ends the conversation.
This is unfortunate. Because the really relevant figure is not the organization-wide average – it is the norm by role. A junior consultant sitting at 60% is a problem. So is a partner sitting at 85%, but for a very different reason.
In this blog, we dive into benchmarks by role and industry so you can set more realistic goals for your team.
Why one standard is misleading
Say you calculate the average billability across your entire organization and come up with 74%. Great right? Not necessarily. Behind that average is a broad spectrum. A junior consultant sitting full-time on client projects can score 88%. A senior manager who divides his time between project supervision, acquisition and internal quality assurance may not get beyond 55%. Both figures are realistic – and healthy – given the role.
The problem arises when you hold everyone to the same standard. Then you do junior employees a disservice in their development, or you judge senior people by a standard that simply does not fit their jobs.
The message: steer for role-specific standards, not one organization-wide number.
What the benchmarks say
International research by SPI Research – the most cited benchmark research in professional services – sets 75% as the optimal threshold for sustainable profitability. In practice, the average comes out lower: in 2025, average billability in professional services was 66.4%, down from 68.9% in 2024.
That’s the organization-wide average. By role, the standards are very different – and that’s where the real information is.
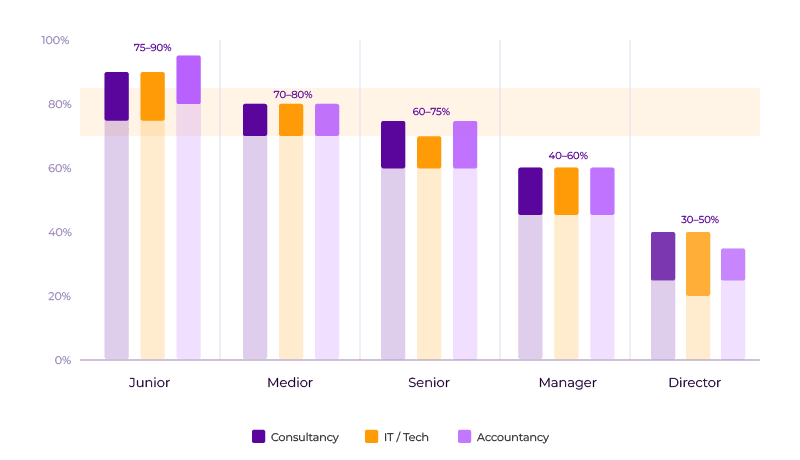
Junior employees: high billability makes sense
Junior professionals – whether in consulting, IT or accounting – have relatively few non-declarative responsibilities. They do not make acquisitions, lead teams or sit on steering committees. That makes high billability both realistic and expected.
Guideline: 75-90%, depending on the amount of internal training and onboarding time scheduled.
Side note: a 90%+ standard sounds efficient, but in practice it comes at the expense of learning and development time. Agencies that structurally schedule juniors at 90% see higher attrition and lower quality growth in the longer term.
Medior employees: the productive core
Medior professionals are carrying a larger share of project execution as well as starting to get involved in internal processes: subject matter consultations, supervision of juniors, attendance at sales meetings. This requires more margin.
Guideline: 70-80%
This applies to IT consultants, medior accountants as well as technical specialists at engineering or technical service providers.
Seniors: less billable, more impactful
Senior employees are the hub of the organization. They monitor quality, supervise colleagues, maintain client relationships and are increasingly involved in acquisition. If you send them on the same billability standard as mediors, the very time needed to deliver that value disappears.
Guideline: 60-75%
A similar standard of 60-70% applies to senior project managers in architecture and engineering firms. The “remaining” 25-40% goes to project support, client consultations, quality assurance and mentoring – non-declared, but essential.
Managers: directing as primary task
Managers at consulting and IT firms spend most of their time managing teams and projects, not on direct client implementation. Yet in practice, you still regularly see excessive billability standards for this group – with the result that management tasks are systematically neglected.
Guideline: 40-60%
Several international sources confirm this: for managers, the declarability target drops to around 60%, and rightly so. Those who completely fill a manager with client hours lose the investment in team development and quality control.
Partners and directors: the organization as a priority
This may sound counterintuitive. Yet it makes sense: partners and directors are primarily responsible for acquisition, strategic client relationships, propositions and the organization as a whole. Their value is not in declared hours, but in bringing in and securing work.
Guideline: 30-50% (depending on desk size and type)
In smaller agencies, where directors are still actively playing along on projects, this may be higher. But once the agency grows and there is more management responsibility, this standard drops quickly.
By industry: what are the differences?
The above benchmarks are largely cross-industry. Nevertheless, there are relevant nuances by industry.
IT and technical service providers can typically achieve higher average billables than other industries. Projects are less seasonal, and the nature of the work – structured sprints, fixed retainer contracts – lends itself better to continuous scheduling. On average, billability in IT consulting is around 72-75%.
Accounting firms have a strong seasonal pattern. Around tax filing and year-end, billability can temporarily spike to 85-90%. Averaged over the year, 70-80% is more realistic, and that average masks large peaks and troughs. An annual standard that does not take into account the quiet summer months structurally sets employees at an unachievable standard.
Management consulting has the most differentiated standards. Average billability for the industry as a whole is around 67-70%, but the spread by role is huge. Juniors at 80%+, partners sometimes below 30% – the organization-wide average says little.
With that, we arrive at the graph below, comparing different industries.
Note that these are guidelines, not absolute rules. The right standard will also depend on your business model (fixed price vs. post-calculation), the stage of your agency (growth vs. stable) and the extent to which you invest in development and innovation.
Declarability vs. utilization rate: an important distinction
Two terms regularly used interchangeably, but measuring something different:
- Declarability measures the percentage of available work time billed directly to clients.
- Utilization rate measures the percentage of available work time spent productively – including internal projects, training and other non-declarable but meaningful activities.
The difference is crucial to planning. Suppose a consultant has a billability of 75%, but also spends 20% of his time on internal tasks. Then that same consultant is actually at 95% utilization. If you then want to increase billability to 85%, you create an overload – even if it looks good on paper.
So always manage both: billability for profitability, utilization for well-being and capacity planning.
Conclusion: steer by role, not average
Declarability of 80% is not a goal in itself. It is an outcome of good capacity planning, clear role assignment and realistic expectation management. The agencies that perform best – both financially and in employee satisfaction – are those that know what a realistic standard is for each type of role, and steer consistently toward it.
Holding everyone to the same standard loses on two fronts: juniors are overworked, seniors are judged by standards that don’t fit their jobs. The result: higher attrition, lower quality and, in the long run, worse customer relations.
The good news? This is exactly the kind of insight you can build with the right resource planning software. Not one number for everyone, but insight by role, by project and by period.